Analysing the distribution between areas
Written by Tim Brody, September 07 2000 11:08:59
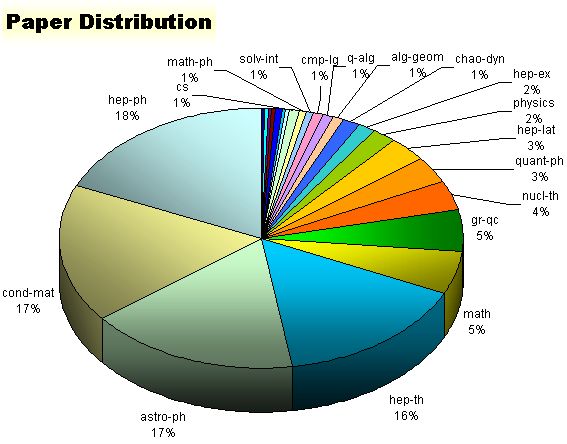
Distribution of Papers to Areas
The following graph shows the distribution of which areas papers belong to in the archive (areas with less than 1% of the total papers are not shown).
Unique authors in each area of the archive (hep is shown as single area).
Distribution of Updates to Areas
By extracting the number of date lines there are in abstract files (the number of paper submissions there has been), and mapping that to the areas of the archive we can build a picture of which areas of the archives have more updates submitted to them.
The following graphs show the distribution of papers with multiple submissions compared to areas i.e. of all papers with 2 submissions (1 update) a certain percentage were in hep-ph.
Papers with one submission are papers that have never been updated. 103233 papers in total.
Papers with two or more submissions are papers that have had updates made to them. 22804 papers in total.
4891 papers in total.
963 papers in total.
227 papers in total.
There are too few papers with 6 or more submissions to give fair results.
Graph of the number of papers with 1, 2, 3, 4 or 5 deposits by area.
What types of updates were made to papers first submitted between Nov 1999 and June 2000.
Graph of the mean number of deposits per paper, by area.
Journal-Ref
Analysing how what papers have Journal-refs compared to the areas.
This graph shows the ratio of papers with journal-refs compared to the total number of papers in that area (phys-lib contains 2 papers).
This graph shows the component amounts of journal-refed and non of the total number of papers in each area.
This graph shows papers with x number of submissions, divided into those with and without Journal-refs.
These graph shows the component amounts of journal-refed/reports/papers with "submitted" or "published" in their comment/papers with "accepted" in their comment and "thesis" in their comment.
Paper state by area for papers submitted in 1994.
Paper state by area for papers submitted in 1998.
This graph shows the distribution of papers with Journal-refs.
This graph shows the distribution of papers with report-no fields (after first removing papers with Journal-refs).
This graph shows the distribution of papers with "thesis" in their comment (after first removing all other types of paper).
The following graphs show how the ratio of Journal-refed papers varies
over time:
| Accepted | Title or comments contain "accepted" |
| With J-R | Has a Journal-ref tag, but no report tag |
| With J-R/Report | Has both a Journal-ref tag and report tag |
| Report | Has a Report tag, but no Journal-ref tag |
| Review | Title or comments contain "review" |
| Submitted | Title or comments contain "submitted" |
| Thesis | Title or comments contain "thesis" |
| Unknown | None of the above |
Degree of Update
This is based on the degree of change made to paper updates, after so many days since initial submission.